

Featured Resource
SchoolStatus Launches Literacy Solution to Help Districts Engage Families in Improving Reading Outcomes
Read More >
SchoolStatus Launches Literacy Solution to Help Districts Engage Families in Improving Reading Outcomes
Read More >

Yes, you already track attendance and send messages to families. But without a complete picture of every student, attendance notices are often ignored and communication fails to build trust. Linking attendance, family engagement, academic, and behavior data bridges this gap by making your outreach personal and relevant. With centralized student data, you can see which students need help, why, and how to best support them.
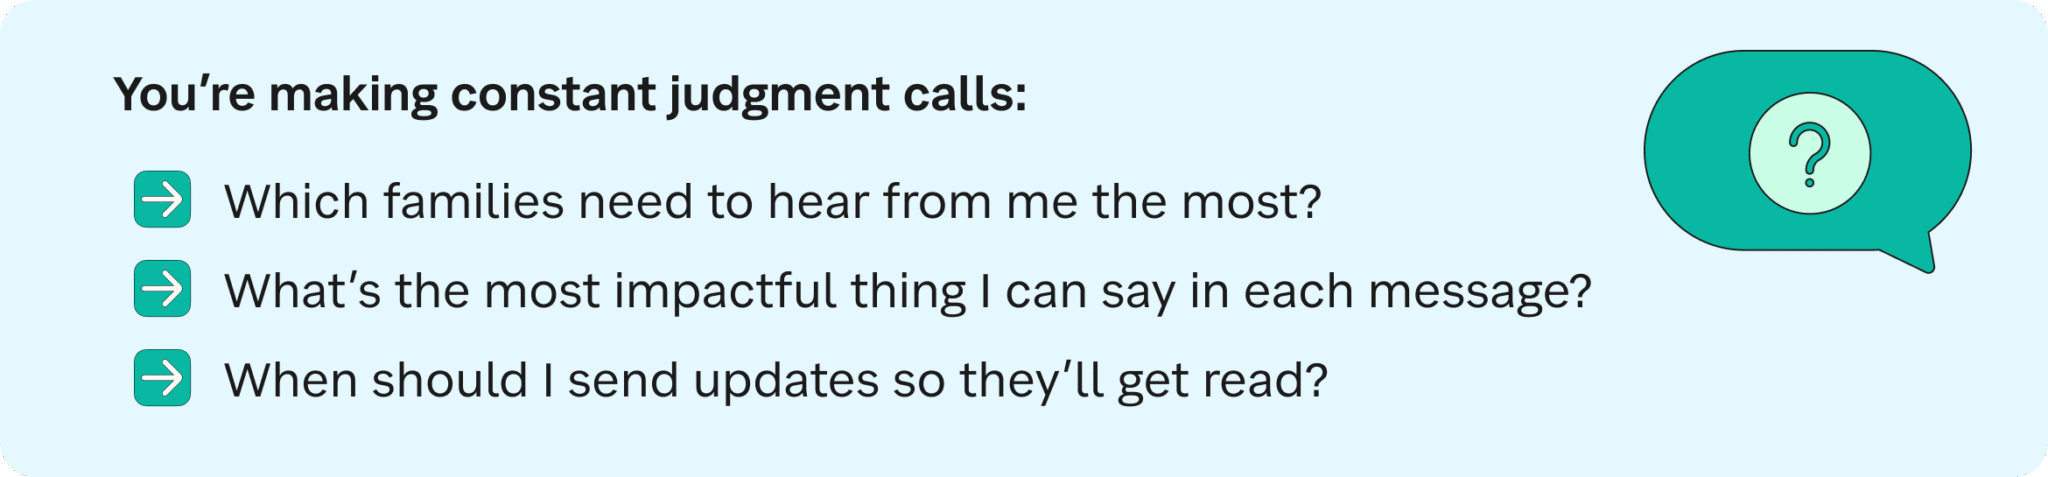
Those decisions are harder when your information is scattered.
Attendance may flag a problem, but not the reason. Communication logs show outreach, but not whether it was timely or effective. This leaves you assembling incomplete information under pressure.
Student insights help remove these obstacles. When you have attendance, academic, behavior, and family engagement data all in one place, you can respond more effectively.
Attendance is often the first sign that a student is struggling. One absence doesn’t tell the whole story, but patterns do.

Repeated tardies, sudden drops, or patterns like missing every Monday often point to deeper issues such as academic struggles, disengagement, transportation problems, or challenges at home. The data shows a student isn’t in class, but you need to find out why.
You need real-time trends to spot concerns early and to check whether your response is working. This lets you intervene before missed days lead to missed learning.
Attendance insights by themselves won’t change outcomes. You also need to communicate effectively with families.
Right now, your outreach is probably scattered. Messages come from different tools in different formats. You can’t tell what families have already received or how they responded. You might follow up several times without knowing if anyone saw your message.
When you connect attendance insights with communication history, you can coordinate outreach across your district. You see what’s been sent, who responded, and where follow-up is needed. You avoid duplicate messages and communication gaps.
Consistent communication solves the coordination problem. But stronger engagement requires personalization.
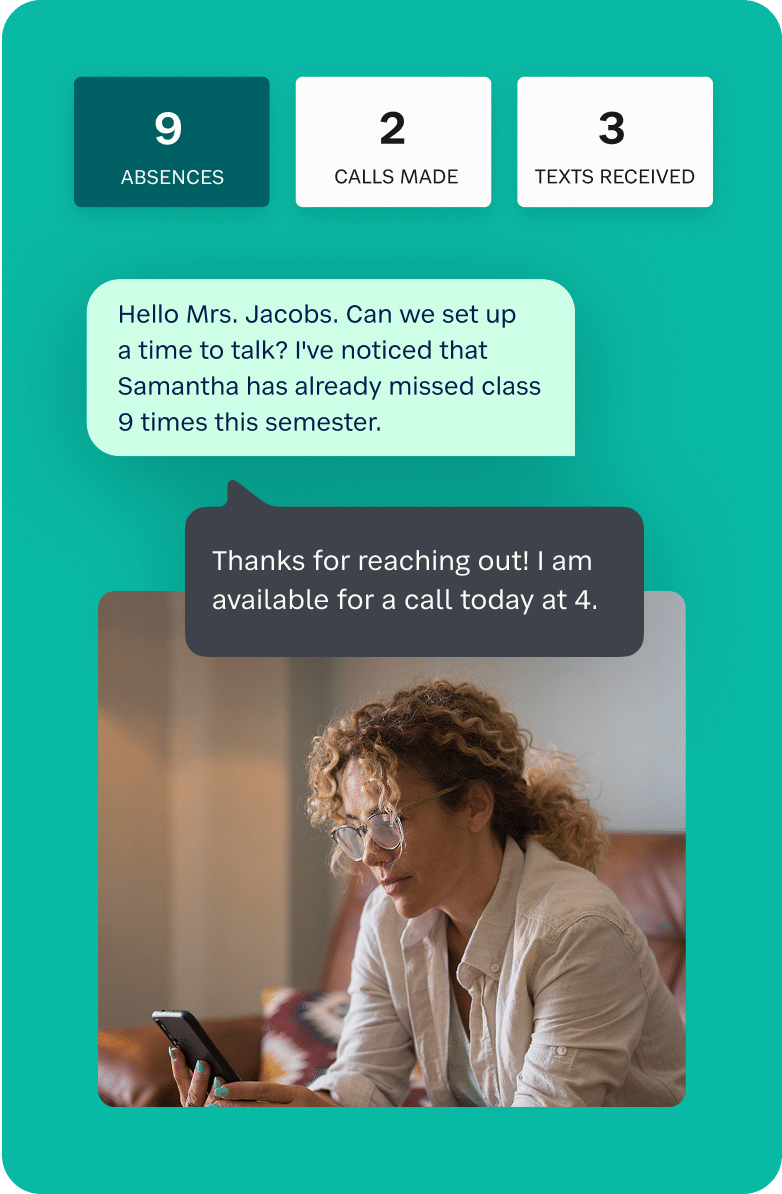
When you combine attendance patterns with academic performance, behavior data, and communication history, you can reach out to families with context that makes sense. Instead of a generic absence notification, you can explain that their student has missed three Mondays, is falling behind in math, and might need extra support. That kind of message shows families you see the full picture of their student.
To make that outreach effective, you also need to understand how each family interacts. Do they open messages, reply to them, or ignore them? What language do they use at home? Do they prefer text, email, phone, or app-based communication? When you use the channel and language that works for each family, they’re more likely to respond.
This is how you build trust. When families receive messages that reflect what’s actually happening with their student, sent in their preferred language through channels they use, they see that you understand both their student’s needs and their communication preferences. They’re more likely to stay engaged and partner with you to help their student succeed.
In Practice:
Family engagement becomes something you can see, measure, and improve. And when families see you’re listening and responding to their preferences, you build the trust that makes real partnership possible.
MTSS interventions depend on good timing and accuracy. Seeing all student information together increases the chances that your supports will work.
Without connected data, MTSS feels like guesswork. Students may be placed in the wrong tier, wasting resources and delaying the help they need. Seeing attendance, grades, and behavior together helps you decide who needs Tier 2 or 3 support.
Each signal tells part of the story. A student missing multiple Mondays might have a transportation issue or a weekend custody arrangement. But when you also see declining math grades and increased office referrals, the picture becomes clearer. They might be avoiding a class where they’re struggling, or they’re disengaged because they’ve fallen too far behind.
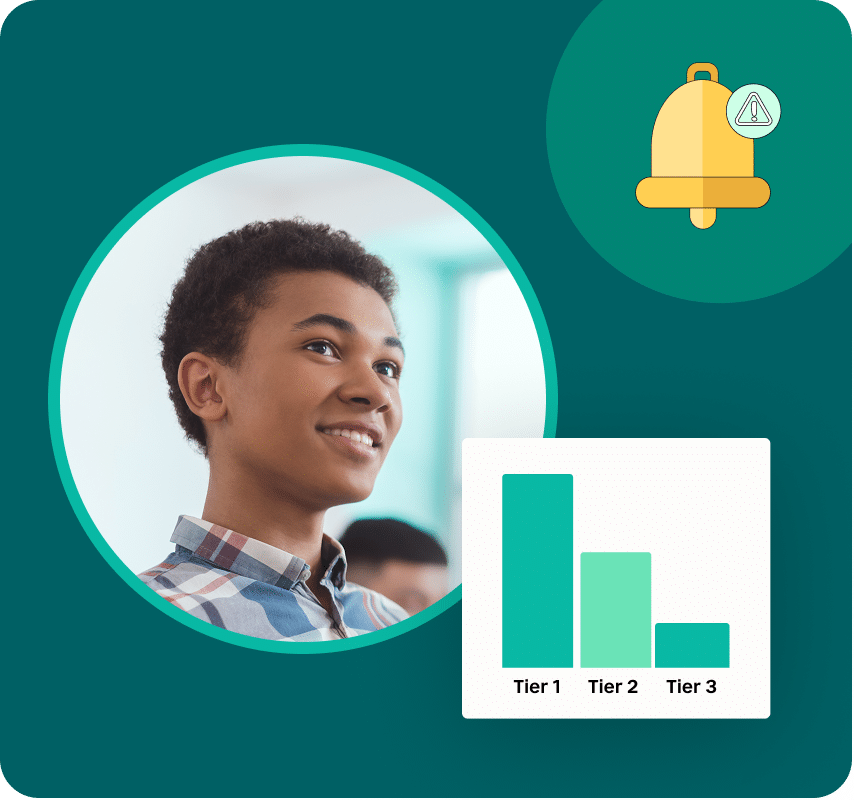
These combined signals help you choose the right tier of support. A student with occasional absences and solid grades probably needs Tier 1 (whole-class strategies). A student with chronic absences, failing grades, and behavior incidents clearly needs Tier 3 (intensive, individualized intervention). Without connected data, you might underestimate severity and delay critical support, or overreact to a single data point and assign intervention a student doesn’t need.
When you connect attendance with academic and behavior data in MTSS, you avoid the mistakes that come from incomplete information. You save time, apply interventions more consistently, and provide support that matches students’ actual needs.
Connected data doesn’t replace your professional judgment. It supports it. You get the full picture, so you can act with confidence and ensure every student gets the right help at the right time.
When you connect attendance, communication, engagement, behavior, and academic data, you get a complete picture of every student.
You see a student with declining grades, increasing Monday absences, and a parent who hasn’t responded to the last three messages. You know they need support. You know outreach isn’t working. You know to try a different approach—maybe a text in Spanish instead of another email.

Your attendance teams spend time understanding why students are absent instead of hunting through systems. Your administrators see patterns across all schools without asking staff to compile reports. Your families get messages that relate to their student, sent through channels they use.
You intervene earlier because you spot patterns sooner. You coordinate better because everyone sees the same information. You personalize your approach because you know what’s working and what isn’t.
This is what connected data makes possible: faster decisions, targeted support, and more time focused on students instead of systems.
Districts across the country are showing that connected data brings clarity and momentum.
![]()
At Jackson Public Schools (MS), leaders wanted student support to continue as children moved schools or programs. By connecting records, staff could see each student’s full history and keep interventions going. As a result, students got steady support during transitions, and teachers saved the time they once spent assembling records.
![]()
Lake Worth ISD (TX) aimed to build trust with families. Parents felt overwhelmed by irrelevant messages. Linking communication to student data let Lake Worth send timely, personalized updates. Families felt more engaged, and the district saw positive outreach responses, showing messages reached the right people.
![]()
Galena Park Independent School District (TX) faced a different challenge: bringing scattered student data together so educators could act with confidence. Before adopting SchoolStatus, the district collected plenty of data, but it lived in separate systems. Staff had to piece together attendance, assessments, and behavior from multiple platforms, often missing critical connections. By the time they assembled a complete picture, opportunities to help had already passed. Now, everything lives in one place. The district also uses connected data for transition planning, identifying at-risk students early, and making strategic decisions like scheduling electives first period for students with attendance challenges. And because student data and family communication live on the same screen, staff can reach families in their home language and see issues sooner.
You already track attendance and communicate with families. But when those systems don’t talk to each other, you waste time hunting for information instead of helping students.

SchoolStatus Attend integrates with your SIS to provide real-time attendance insights. You see dashboards that highlight missed class time, tardiness, and early signs of truancy. You can filter by school, teacher, or grade level to spot patterns and take action across your district.

SchoolStatus Connect brings student data and family communication together on the same screen. You see attendance, grades, and behavior alongside communication history. You know what’s been sent, who responded, and which families need a different approach. Messages auto-translate into 130+ languages and go out through each family’s preferred channel, whether it’s text, email, phone, or app.
Together, SchoolStatus Attend and SchoolStatus Connect give you a more complete picture. You spot patterns earlier, coordinate your response across the district, and personalize outreach based on what you can see is working. That means less time searching for answers and more time supporting students.


