For Student Services Leaders: Turning Support Teams into a Single Source of Help for Families
read more


SchoolStatus Launches Literacy Solution to Help Districts Engage Families in Improving Reading Outcomes
Read More >
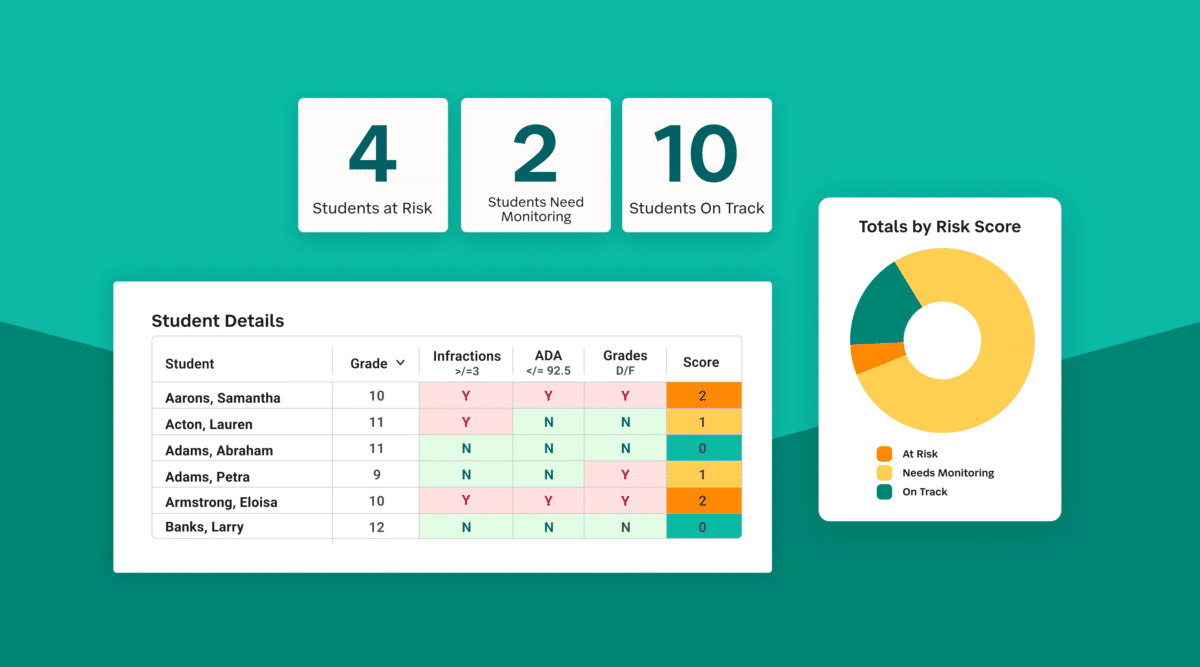

Districts already have the data they need to identify struggling students early. The challenge is that attendance, behavior, and academic data live in separate systems, so a student with three compounding challenges can look like three unrelated issues. SchoolStatus Connect’s new At-Risk Dashboard brings those signals together so leaders can act earlier, before small challenges compound into a crisis.
Here’s a scenario student services leaders recognize: a student shows up on a behavior report in October. A counselor pulls their file and discovers they’ve also been absent for 12 days since school started. A quick check with the grade-level team reveals two Ds and an F. Three people, three systems, three separate conversations, all for one student who needed support in August.
The data existed. It just lived in different places. When a student services coordinator needs to cross-reference attendance records, pull grade data, and track down behavior logs from three separate systems, that process takes time — and in triage, time is the thing nobody has. By the time the full picture comes together, another week has passed. Another absence. Another failed quiz.
A single dashboard that surfaces attendance, behavior, and academic data together changes that entirely. Open it in the morning, and you know, immediately, which students need your attention and why. Earlier conversations with families are warmer and more productive. Earlier interventions are lighter and more effective. The students who need the most support get it while there’s still plenty of runway to make a real difference.
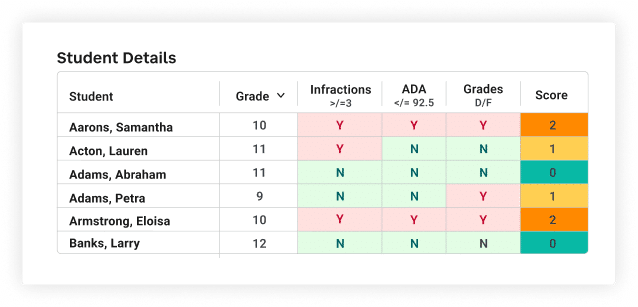
SchoolStatus Connect’s At-Risk Dashboard was built around a straightforward premise: a single data point can mislead. A student with low attendance might be dealing with a family health crisis. A student with a couple of behavior infractions might be having a hard month. But a student showing up less than 92.5% of the time, carrying at least one D or F, and accumulating more than three behavior infractions? That combination tells a more complete story.
The dashboard shows where students stand on all three factors. School and district leaders can see who needs support now, before the quarter ends, before the family conference, before chronic absenteeism becomes the headline.
Connected data does something else that single-metric systems can’t: it points leaders toward the right kind of help.
A student with significant behavior infractions and multiple failing grades may actually need academic intervention. Something is happening in the classroom, or at home, that’s showing up in two places at once. When leaders can see the full picture, they can direct a response that fits the actual situation, and that precision matters. The right intervention lands. The student gets meaningful support. Staff time goes where it will make the biggest difference.
The At-Risk Dashboard is a view and a starting point. Once leaders identify students who need support, they can launch outreach directly through Connect, sending targeted messages to families with relevant, timely information. They can also use the list to direct school-level conversations, coordinate with counselors, or prioritize referrals to community partnerships.
Identification and action can happen in the same place, close together in time. When communication is meaningful and arrives early enough for families to help, trust grows. And that trust is what gets students the support they need to succeed.
If your district uses SchoolStatus Connect High Impact, head to the reports section to see the At-Risk Dashboard. If you’re not yet a Connect customer, we’d love to show you how bringing data and communication together can change outcomes in a personalized demo.
The dashboard uses three data points: average daily attendance below 92.5%, at least one D or F grade, and more than three behavior infractions. The data is pulled from a district’s student information system (SIS).
Data is updated at a schedule determined during implementation. If you elect to pull data from your SIS more frequently, you’ll be able to intervene sooner.
Yes. After identifying students, leaders can launch targeted messages to families directly through Connect, or use the list to guide off-platform interventions like counselor check-ins, staff conversations, or resource referrals.
The At-Risk Dashboard looks across behavior, grades, and attendance together in a single view. It’s built for student services and district leaders who need to identify students with compounding challenges and move quickly to the right intervention.
 Dr. Kara Stern
Director, Education and Engagement
Dr. Kara Stern has seen school from just about every angle: high school English teacher, middle school principal, fellowship director for math and science teachers across New York City, and head of school at a rural N-12 school. That breadth is what she brings to her work at SchoolStatus, where she writes, speaks, and challenges educators to build the kinds of school communities where every student thrives. She holds a Master’s in Education Leadership from Teachers College and a Ph.D. in Teaching and Learning from NYU.
News, articles, and tips for meeting your district’s goals—delivered to your inbox.
















Ready to learn more about our suite of solutions?