5 Ways to Get Attendance Back on Track
read more


New Book Gives District Leaders a Practical Framework for Improving Chronic Absenteeism—and a Comprehensive Look at State-Level Attendance Policies
Read More >
Key Attendance Trends from the 2025-26 School Year: Insights from 1.1M Students
Read More >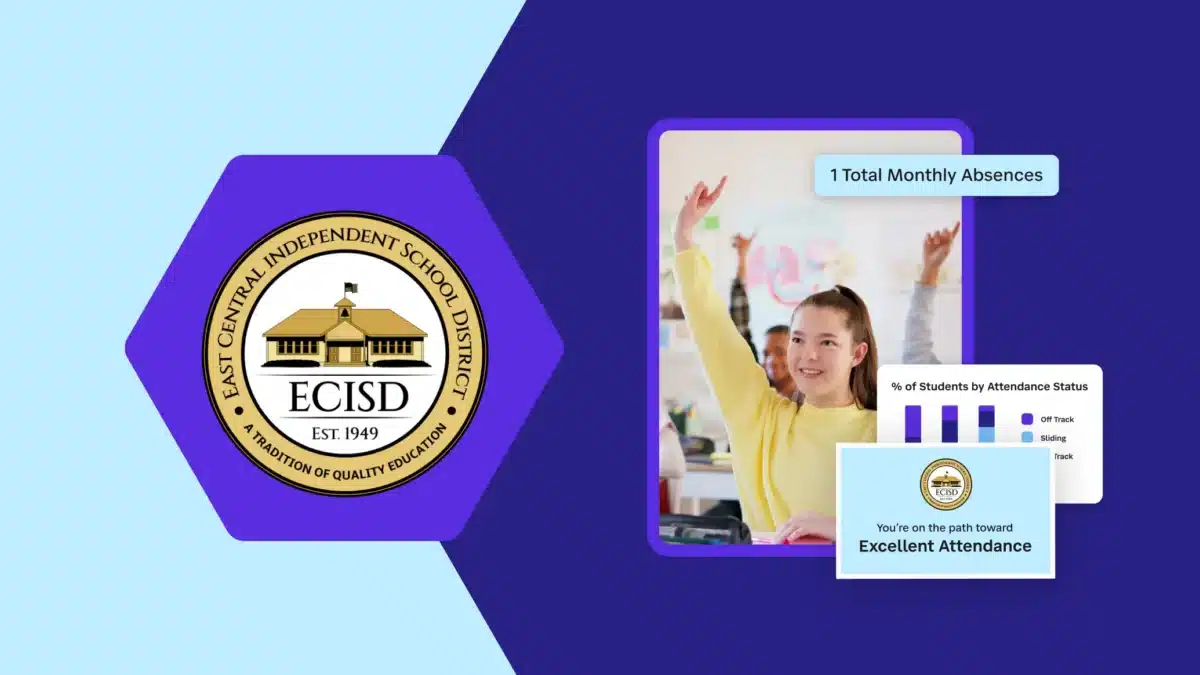

Six or seven weeks into a school year, the real patterns show up. East Central ISD, a fast-growing Texas district spread across 296 rural square miles, ran its attendance data through one report and found three separate problems: a Friday problem, a bus-route problem, and a connection problem. They built a fix sized to each one and cut chronic absenteeism 12% in their first year with SchoolStatus Attend.
Meredith Powell’s title is AWARE Project Manager, short for Advancing Wellness and Resiliency in Education. Her job is simpler than the title suggests: she works with campus leaders across East Central ISD‘s fifteen schools to look at attendance the way a student actually experiences it, as one specific kid who got to school that day or didn’t, always for a reason.
East Central’s first pattern showed up around week six or seven, once the real numbers replaced the back-to-school noise: Fridays. The district’s Total Absence Calendar Report lays out every day side by side, so a bad Friday doesn’t get buried in a spreadsheet nobody reopens until winter break. East Central saw the pattern quickly and built a response: attendance pop-ups, incentive days, dances, and student speakers. Give students a real reason to show up on a Friday, and more of them do.
The same report caught a second pattern: every year, attendance dropped sharply on the Monday after the Super Bowl. District leadership stopped fighting that pattern and moved the day to a “staff development day” instead. Now, no student is marked absent for a day the district already knew was coming.
East Central’s data team went a layer deeper, building attendance percentages by bus route to see which routes ran low and why. It sounds like an unusual thing to track, until you call the families riding those routes. The reasons turned out to be simple.
I don’t want my child standing alone at that distance from our house. Could the drop-off spot move a little closer?
“We were never going to have that feedback if we didn’t have the data to prompt our thinking first,” Powell said.
East Central moved the stop and shortened the walk. One family got a shorter, safer route to the bus, a fix the district found only because someone finally asked.
Attendance data tells you something’s wrong. It doesn’t tell you why. East Central paired its attendance numbers with school climate survey results, and a pattern emerged: students who were chronically absent were also more likely to report feeling disconnected at school.
Once the district could see this link, they could act on it early. A student who’s missing school and feeling disconnected gets paired with a staff member for ongoing check-ins, in addition to the automated outreach every family already receives. The outreach starts even earlier. If a student doesn’t show up for homeroom, the teacher calls that same day to ask, directly: Hey, is your child okay? We would love for them to come to school today, even if they’re late.
Carry that tone from the homeroom phone call through the automated intervention letter, and families respond differently. Powell has seen it firsthand: families now bring concerns straight to campus staff about transportation, basic needs, and healthcare, because they’ve learned someone on the other end will act on it.
East Central built all of this from attendance data it already had, using the team already in place. The district asked better questions of the numbers and matched each fix to the size of the problem: a program day for Fridays, a moved bus stop for one family, a same-day phone call for one student. Multiplied across 11,176 students and 15 schools, that adds up to something simple: more students picked up, called on, and supported, one bus route and one homeroom at a time.
See what a districtwide view of your attendance data could show your team.
It’s a single, districtwide view of every day’s absences side by side, so leaders catch a spike as it happens instead of finding it in a quarterly summary. East Central used it to spot its Friday pattern within one semester.
East Central used the bus-route breakdown to start a conversation. When a route showed a low attendance rate, someone on staff called the families riding it and asked what was going on. The fixes that came out of those calls were logistical, like moving a drop-off spot closer to a family’s home. That’s the model: spot a pattern, then ask a real question about it.
It changes who gets matched with extra support. A student who is chronically absent and reporting feeling disconnected on a climate survey gets paired with a staff member for regular, personal check-ins, on top of the automated outreach every family already gets.
In their first year with SchoolStatus Attend, chronic absenteeism dropped 12%, and 51% of students who received an automated intervention never needed a second one.
East Central’s data team built the bus-route view internally. The core practice behind it, pulling one report and asking what it’s actually telling you, works at any district size. The Total Absence Calendar Report is already built into SchoolStatus Attend, so any team can start there.
 SchoolStatusSchoolStatus connects educators and families around the topics that matter most. The company partners with K–12 districts to improve attendance, engage families, and build trust so students can succeed. A recognized leader in data-driven attendance and family engagement solutions, SchoolStatus enables districts and educators to engage families with relevant, timely communications and proactive support on important topics including absenteeism, literacy progress, and overall student readiness. Today, SchoolStatus supports districts in all 50 states and serves more than 22 million students nationwide as a trusted partner in driving better student outcomes.

News, articles, and tips for meeting your district’s goals—delivered to your inbox.

Ready to learn more about our suite of solutions?